 |
|
|
| |
|
|
Below follows a description of the necessary steps to submit an analysis to inkascore.org. In order to be able to submit an analysis, users are required to log in first. If you do not have yet credentials to do so, please register first.
Human phospho-proteomics mass spectrometry data is a prerequisite for using InKA. Murine or other species will not work. The human data needs to have been searched against a (preferably Uniprot) human FASTA file with MaxQuant version 1.4 and newer. From the txt search result files (which can be found in combined and txt subfolder, except for the experimentalDesignTemplate.txt file which is usually one directory-level up) the following files need to be assembled into a single zip archive.
Currently, the choice of experiment names is important for proper functioning of the inkascore pipe-line. As part of the code is written in R which dislikes column names starting with digits, using experiment names that start with a digit will give problems. Avoid using digits as the first character in the experimentalDesignTemplate.txt file before starting the search, in order to circumvent this problem.
It is very important that the Max Quant search is performed with an experimentalDesignTemplate.txt file that contains a valid Experiment column. Each of the different Experiment entries will trigger an independent InKA analysis in the results and these names will be used in the results (unless a labels.txt file is used, see below). If this column is absent, the InKA analysis will fail.
If the names of the original experiments in the MaxQuant search are sub-optimal for further analysis, it is possible to include in this zip archive an additional tab-separated file to replace the names in the inka analysis results by more suitable names. This file should be named labels.txt and be formated row-wise for each sample, with the old names that need to be replaced in the first column, and the desired new names in the last column. This file will be detected by the InKA pipe-line and will enforce automatically the name changes. Note that the new names should all be unique, preferably contain no white-spaces and be exclusively composed of alpha-numeric characters, dot or underscore. Addition of an extra column between the first and last one, can be used to add colors to heatmaps and barplots in the analysis results. This column should be named case-sensitively barcolors.
An example pTyr IP input zip archive can be downloaded from here. This archive includes a labels.txt to illustrate the name changing possibilities and use of color. There is also a TiOx enriched input zip archive.
In order to perform an analysis, users are required to log in. If you do not yet have credentials to log in, please register first. After logging in you will see something like this.
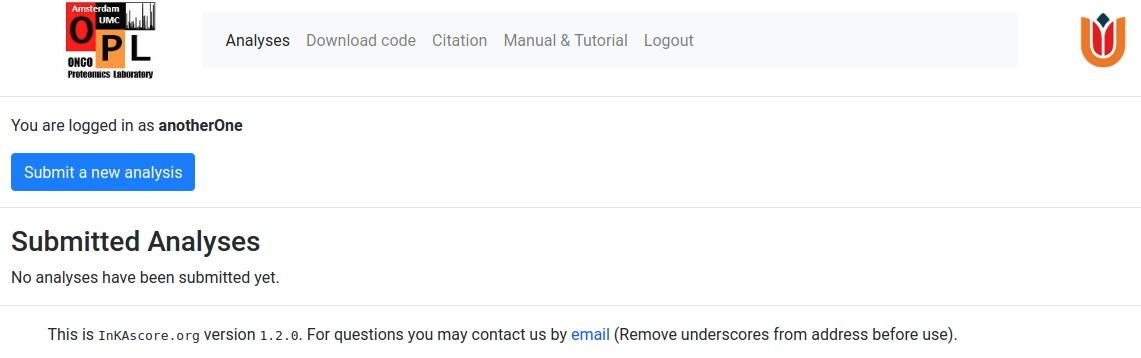
Press on the Submit a new analysis button and this will bring you to the analysis submission window.
The analysis submission page requires the user to give the new analysis a name and also provide very a short description of the type of samples. This page briefly reiterates the preparation of the input archive.
Next, the user has to specify whether the sample underwent a phospho-Tyrosine specific enrichment. By default, a p-Tyr IP enrichment is assumed, but if other is chosen, the resulting phosphorylation network will be thinned out to prevent ending up with a phosphorylation hairball. Furthermore, unskewing of the InKA plot will be enabled in this case to compensate for the relatively larger number of substrate sites that can be assigned to serine and threonine kinases.
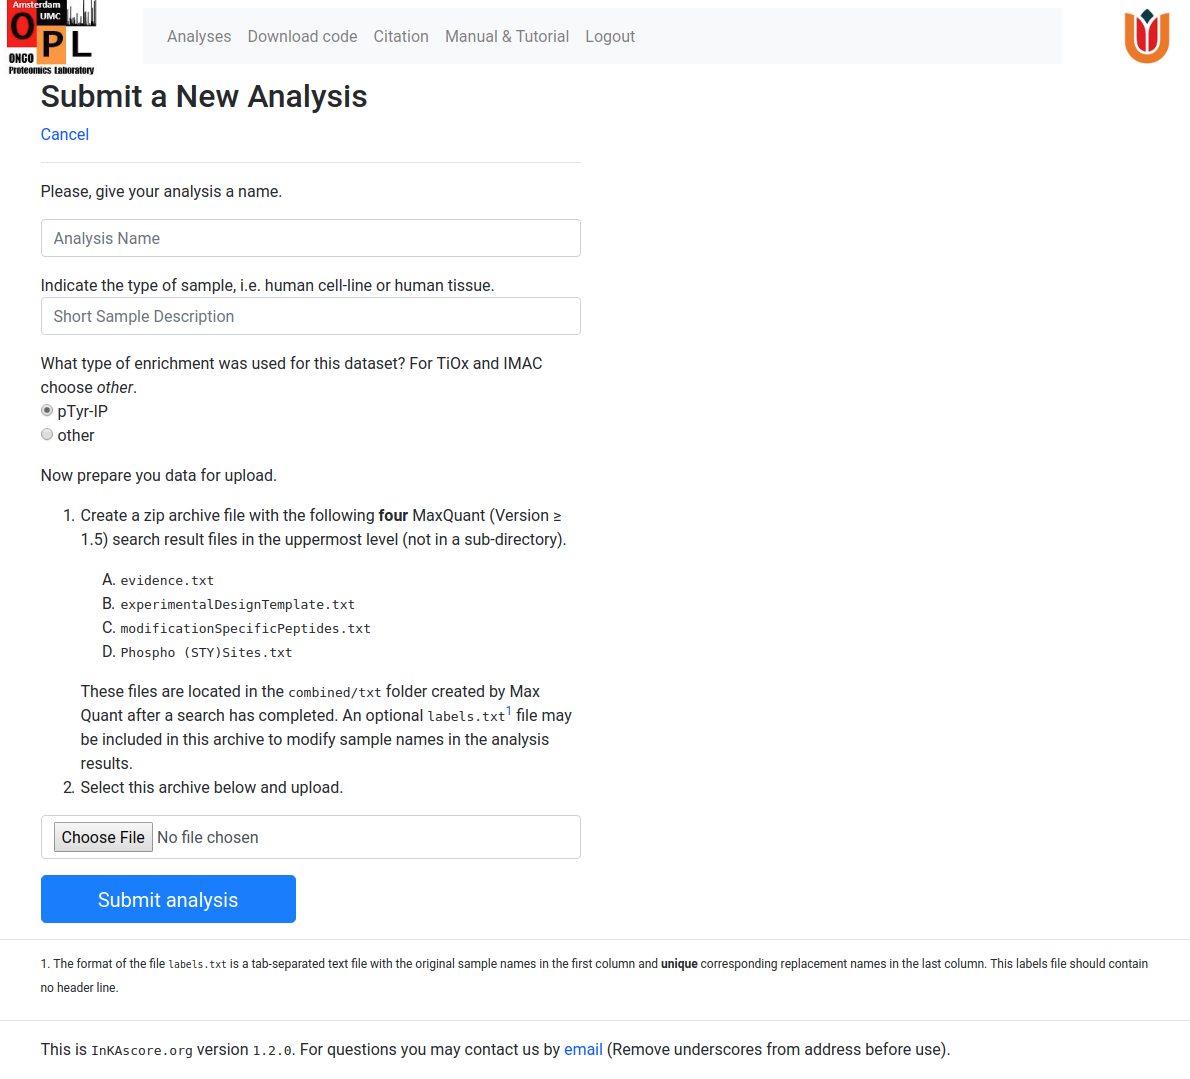
After filling in these fields, the user can click on the Choose File button and select the previously prepared zip-archive containing the data to analyse. After file selection and confimation, the user is brought automatically the the Analyses page, where the submitted analysis should listed. The Status field in the list reflects the progress of the analysis and will progress though a number of stages. A status of Ready means that the analysis has finished and the results of the analysis can be downloaded. At this point, the user will also receive an email confirming this. A small analysis can take approximately a few tens of seconds, whereas analyses on very large data-sets can take up to several minutes.
Note that this page requires to be able to reload automatically to give up-to-date information about the status of your analysis. If automatic reloads are turned off in your browser, turn this possibility on or reload this page manually until the analysis has finished. You will also recieve an email that your analysis has finished.
After the analysis is finished the Status and results fields of the submitted analysis, change and obtain the following appearance
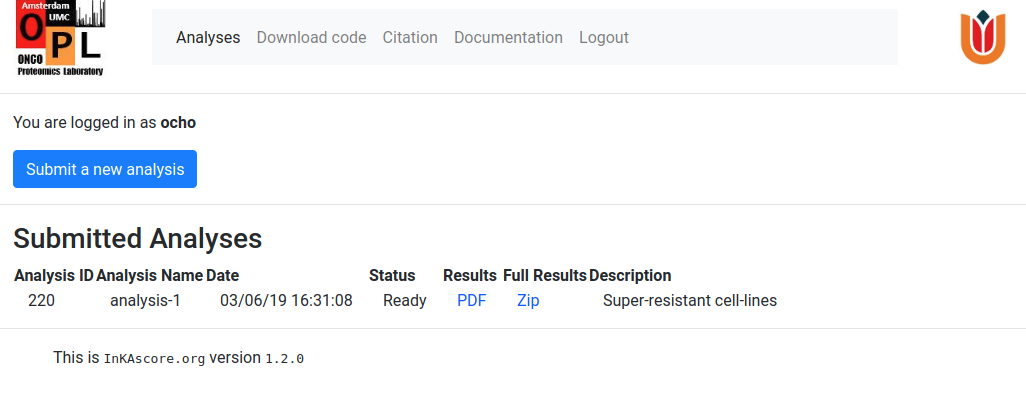
The Results link points at a pdf document that contains several sample specific plots,distributed over two pages per sample, that illustrate different kinase activity metrics. On the top of the first page, the four different kinase activity metrics that constitute the InKA score are displayed separately for the top ranking kinases. Below, the InKA score plot shows all kinases in the sample plotted by their InKA score on the y-axis and InKA score constitution reflected in the x-axis. Kinases missing kinase-substrate information are shown to the left of this plot. The bottom of the page depicts a kinase ranking based on InKA score. The second sample page presents a phosphorylation network, based the sample specific phospho-proteomics data. The discribed document, derived from the example data-set, can be seen here.
Clicking on the Full Results link will start the download of a zip archive containing the above mentioned pdf document, but also a second pdf document with heatmaps of all kinase activity metrics over all samples and barplots that make it easy to compare kinase activity across several samples. An example of this document for the sample data-set is provided here. This zip archive are also contains five tab-separated tables with all separate kinase activity metrics for all kinases and samples. This is a format that can easily be imported into e.g. R for further analysis. An example of these tables for the example data-set can be found here.